libs <- c("sccomp","Seurat","tidyverse","ggpubr")
suppressMessages(
suppressWarnings(sapply(libs, require, character.only =TRUE))
)
sccomp Seurat tidyverse ggpubr
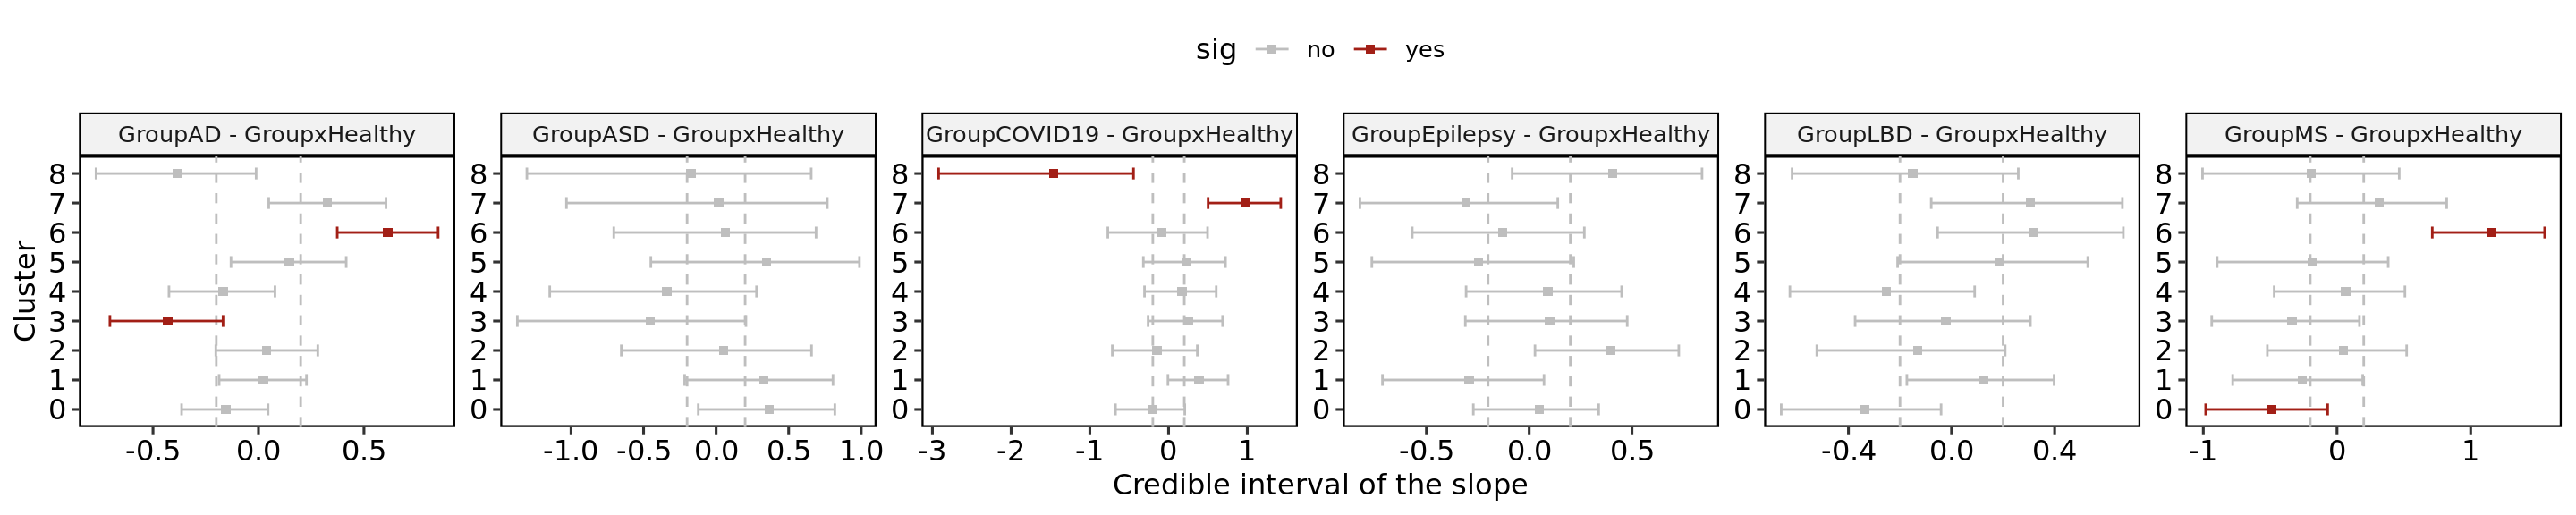
TRUE TRUE TRUE TRUE This script depicts the evaluation of the expansion or depletion of each HuMicA cluster in each pathology in comparison to healthy controls, related to Figure 4.
libs <- c("sccomp","Seurat","tidyverse","ggpubr")
suppressMessages(
suppressWarnings(sapply(libs, require, character.only =TRUE))
) sccomp Seurat tidyverse ggpubr
TRUE TRUE TRUE TRUE The sccomp tool tests differences in cell type proportions in single-cell data. For more details check https://github.com/MangiolaLaboratory/sccomp or https://www.bioconductor.org/packages/release/bioc/html/sccomp.html. Important note: the new 1.8.0 version of sccomp has discontinued some of the functions used in this script as the pipeline suffered considerable changes.
# sccomp with contrast (each group vs healthy controls)

## rename some categories to remove blank spaces
Humica@meta.data <- Humica@meta.data %>% mutate(Group = str_replace(Group, "No Neuropathology", "xHealthy"))
Humica@meta.data <- Humica@meta.data %>% mutate(Group = str_replace(Group, "COVID-19", "COVID19"))

## calculate differential composition
res = Humica |>
  sccomp_glm(
    formula_composition = ~ 0+Group,
    contrasts =  c("GroupAD - GroupxHealthy","GroupASD - GroupxHealthy","GroupCOVID19 - GroupxHealthy",
                   "GroupEpilepsy - GroupxHealthy","GroupLBD - GroupxHealthy","GroupMS - GroupxHealthy"),
    .sample =Sample_ID,
    .cell_group = integrated_snn_res.0.2 ,
   bimodal_mean_variability_association = TRUE,
    cores = 5
  )
# Boxplot of the group proportion, faceted by cluster. The blue boxplots represent the posterior check and the outliers are coloured in red.
plots = plot_summary(res)
plots$boxplot## Plot the estimates of differential composition
### define if each comparison is significant or not
res$sig<- ifelse(res$c_FDR<0.05, "yes", "no")
ggplot(res, aes(x = factor(integrated_snn_res.0.2, levels= levels(Idents(Humica))),
y = res$c_effect, color=sig)) +
geom_point(stat = "identity", shape = 15) +
scale_color_manual(values = c("grey","#A21F16"))+
geom_hline(yintercept = c(-0.2,0.2), linetype = "dashed", color = "grey") +
geom_errorbar(aes(ymin = c_lower, ymax = c_upper), width = 0.4) +
facet_wrap(~parameter,scales="free",ncol = 6)+
ylab("Credible interval of the slope")+
xlab("Cluster")+
coord_flip()+
theme_pubr()+
border()Warning: Use of `res$c_effect` is discouraged.
ℹ Use `c_effect` instead.
Use of `res$c_effect` is discouraged.
ℹ Use `c_effect` instead.